terraform graph: Getting a visual representation of terraform code
2 min read | by Jordi Prats
Using the terraform graph we can theoretically get a visual representation of either the plan or the current configuration
We have options like the -type flag to select the type of graph to output (plan, plan-destroy, apply, validate, input or refresh) but it's easier to just run it without any arguments to get a graph of the current configuration:
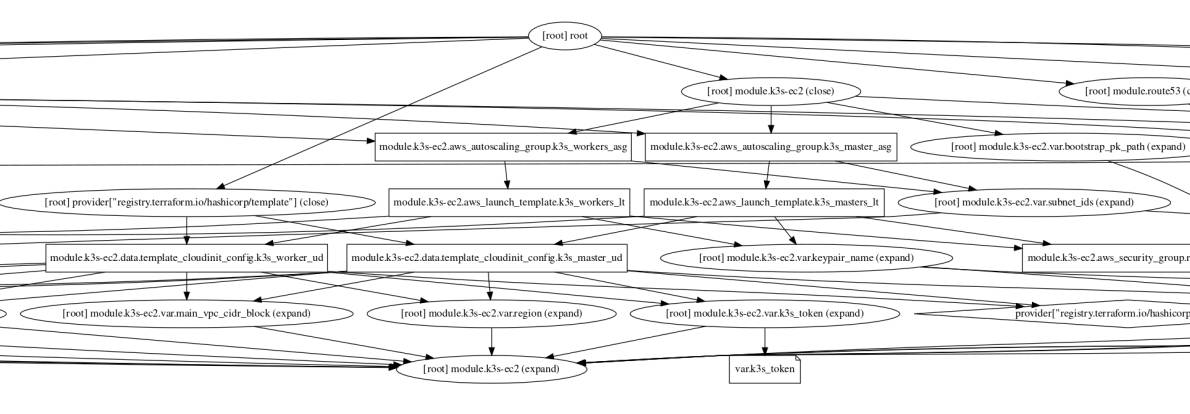
$ terraform graph | dot -Tsvg > graph.svg
Even for medium projects it can generate a graph that's nearly impossible to understand:
If we want to genarate a graph of a set of actions, such as a plan, we'll need to save it first like so:
$ terraform plan -out test_plan
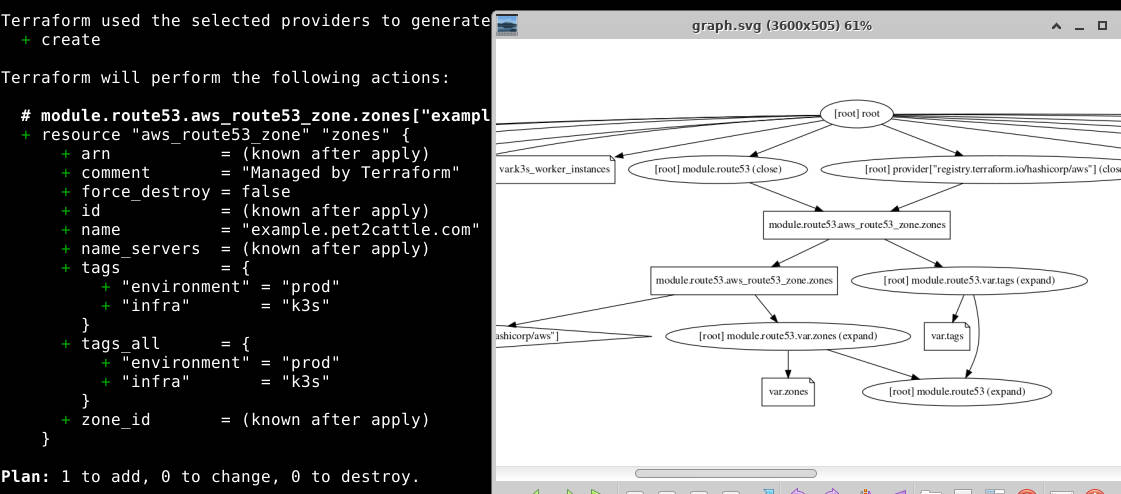
To then generate just a graph representing just the plan we just need to use the -plan option specifying the file we have used to save the plan:
$ terraform graph -plan=test_plan | dot -Tsvg > graph.svg
This way, we'll get an easier to understand graph:
Posted on 04/07/2022